First exploration of RPG dataset
Identification of the case study
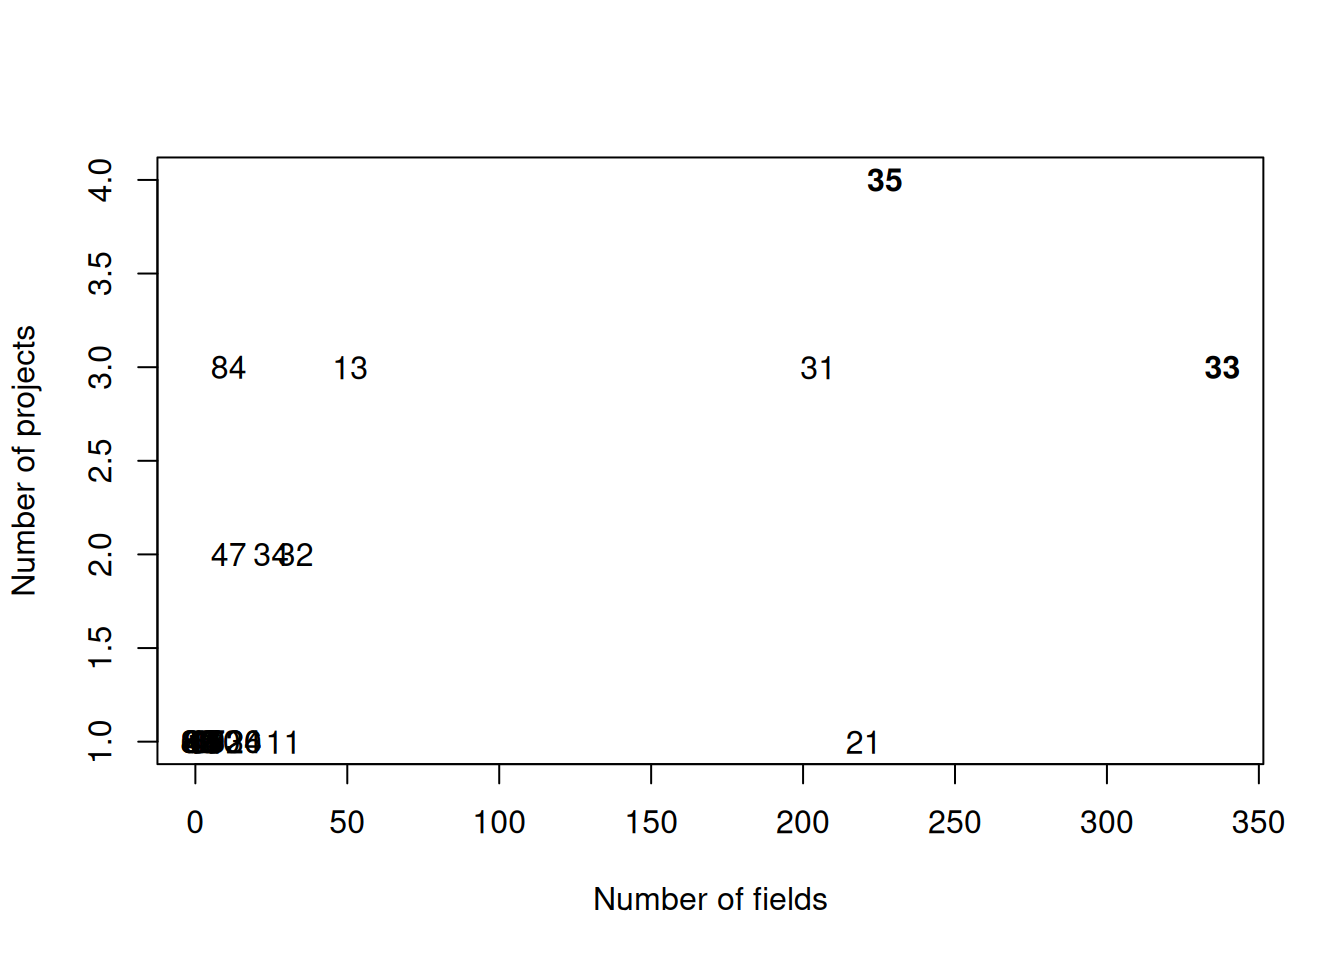
On October 2nd, the dataset consisted of 1472 field coordinates, spread over 27 French departments. Two departments seems to offer ideal case study (Figure 1) :
- Ille-et-Vilaine (35) with 4 different datasets and 227 points;
- Gironde (33) with 3 different datasets, and 338 points.
Spatial coverage
RPG sequence de culture
Let’s try using the RPG sequence de culture from
Girault, Baptiste; Martin, Philippe, 2025, “Séquences de culture, France, 2015-2023”, https://doi.org/10.57745/VMYCYM, Recherche Data Gouv, V2
The main advantages are that (1) it is very easy to download (one file per department), (2) relatively light (100Mb per file), (3) can retrieve the full crop sequence (2015-2023) in a single operation.
The main drawbacks are that (1) it doesn’t contain RPG complété information (coordinates might fall outside the dataset) and (2) the fields are subdivided so it’s harder to get information on field size.
To get more information about the crop classes, the following companion dataset is needed:
Girault, Baptiste; Martin, Philippe, 2023, “Référentiel des cultures RPG”, https://doi.org/10.57745/FMP8GU, Recherche Data Gouv, V1
| BIOMHE | BISCO | DIVAG | SEBIOPAG_ZAAr | |
|---|---|---|---|---|
| FALSE | 1 | 1 | 0 | 0 |
| TRUE | 39 | 26 | 40 | 120 |
| BACCHUS | LepiBats | OSCAR | |
|---|---|---|---|
| FALSE | 14 | 18 | 3 |
| TRUE | 258 | 28 | 17 |
The coverage of RPG sequence de culture is very good in Ille-et-vilaine (Table 1, only 2 missing fields), but less complete in Gironde (Table 2, with 35 missing fields).
RPG Complete
A team from INRAE are completing the RPG with fields that are not included originally. For each of these fields, the crop sequence is also provided since 2016.
The RPG complete 2023 is not fully released yet (missing regions), so we will explore the dataset of 2022.
Cantelaube, Pierre; Lardot, Benjamin, 2024, “RPG complété 2022 Région Nouvelle-Aquitaine”, https://doi.org/10.57745/6FNRWO, Recherche Data Gouv, V5 (d33: 47Mb compressed, 171Mb extracted)
Cantelaube, Pierre; Lardot, Benjamin, 2024, “RPG complété 2022 Région Bretagne”, https://doi.org/10.57745/DL3O6C, Recherche Data Gouv, V1 (d35, 53Mb compressed, 180Mb extracted)
| BIOMHE | BISCO | DIVAG | SEBIOPAG_ZAAr | |
|---|---|---|---|---|
| None | 1 | 0 | 0 | 0 |
| RPG | 39 | 26 | 40 | 120 |
| RPG Complete | 0 | 1 | 0 | 0 |
| BACCHUS | LepiBats | OSCAR | |
|---|---|---|---|
| None | 0 | 17 | 3 |
| RPG | 258 | 28 | 17 |
| RPG Complete | 14 | 1 | 0 |
The RPG complete doesn`t solve all the issues of sites not fitting within agricultural fields (Table 3, Table 4)…
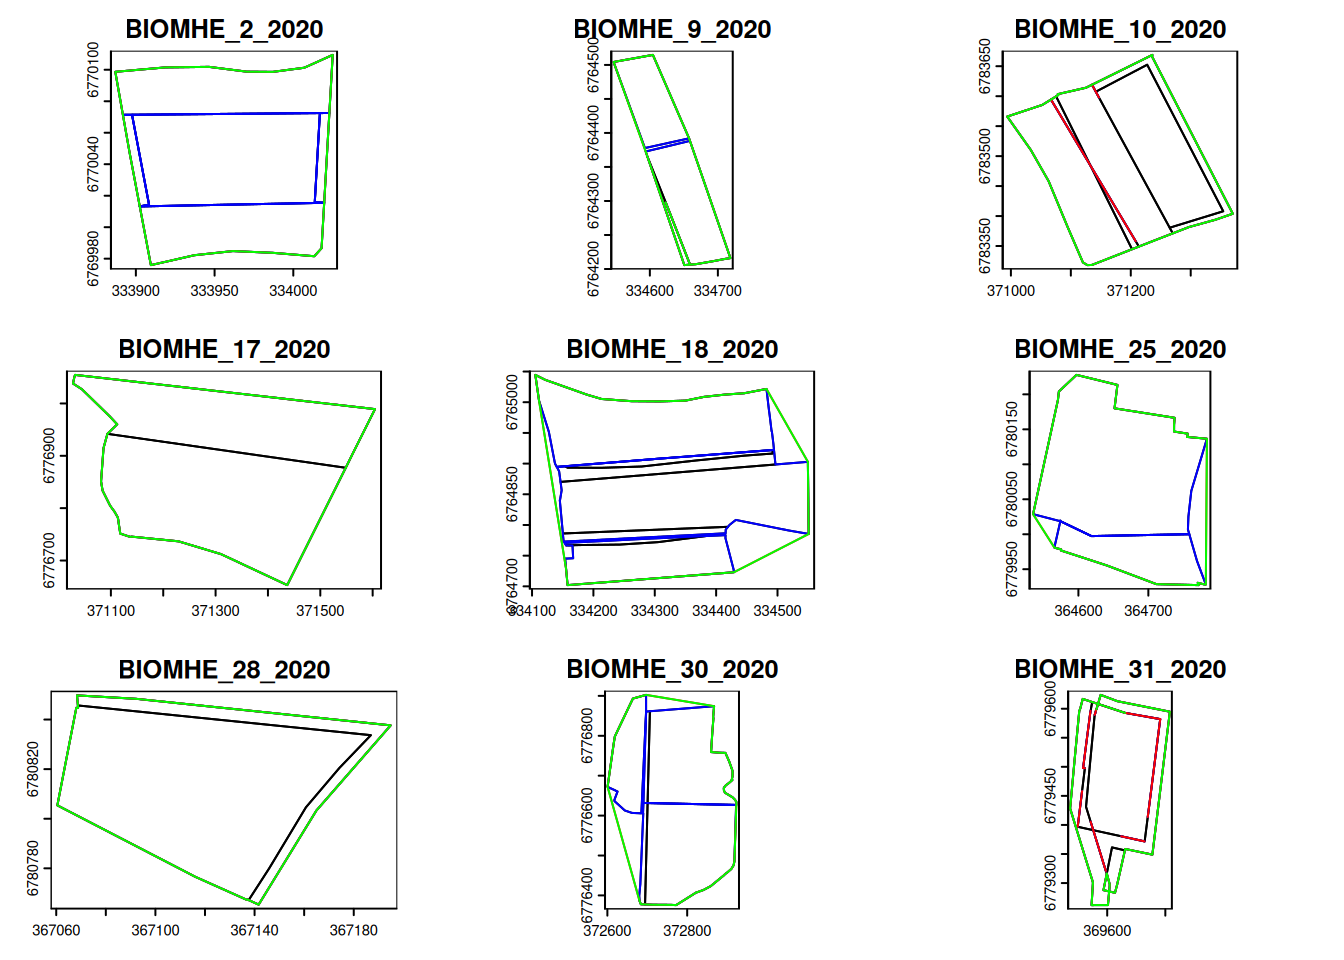
A first visual exploration seems to indicate samplings from vineyard or forested areas (Figure 2, Figure 3).
Visual exploration
Fields in RPG sequence de culture and RPG complete are very patchy from Figure 3. We will complete the data with OSO land cover (see land cover exploration).
TO BE DISCUSSED:
- should we remove points that don’t fit within a RPG / RPG complété field (e.g. incorrect coordinates, or non-interesting sampling site - urban or forest)?
Crop rotation (2015-2023)
Let’s zoom in Ille-et-vilaine (35) with the RPG sequence de culture on crop rotation.
The most common crops are shown in Table 5.
| Var1 | Freq | Nom | |
|---|---|---|---|
| 4 | BTH | 522 | Blé tendre d’hiver |
| 37 | PTR | 345 | Autre prairie temporaire de 5 ans ou moins |
| 23 | MIE | 299 | Maïs ensilage |
| 24 | MIS | 189 | Maïs |
| 30 | ORH | 98 | Orge d’hiver |
| 11 | CZH | 97 | Colza d’hiver |
| 19 | MCR | 78 | Mélange de céréales |
| 27 | MLG | 52 | Mélange de légumineuses prépondérantes au semis et de graminées fourragères de 5 ans ou moins |
| 29 | MPC | 38 | Mélange de protéagineux (pois et/ou lupin et/ou féverole) prépondérants semés avant le 31/05 et de céréales |
| 18 | LUZ | 29 | Autre luzerne |
The most common crop sequences are shown in Table 6.
| rotation | Freq |
|---|---|
| MIS,BTH,MIE,BTH,MIE,BTH,MIE,BTH,MIE | 21 |
| PTR,PTR,PTR,PTR,PTR,BTH,MIE,BTH,MIE | 8 |
| BTH,MIS,ORH,BTH,MIS,ORH,BTH,MIS,ORH | 7 |
| CZH,BTP,MLC,CZH,MCR,MLT,CZH,SGH,CZH | 7 |
| LUZ,LUZ,LUZ,BTH,MIE,BTH,MIE,BTH,MIE | 7 |
| MIS,BTH,MIS,BTH,MIS,BTH,MIS,BTH,MIS | 7 |
| BTH,BVF,BTH,MIE,BTH,MIE,BTH,MIE,ORH | 6 |
| BTH,MIE,BTH,MIE,BTH,CZH,BTH,MIE,MIE | 6 |
| BTH,MIE,BTH,MIE,BTH,MIE,MIE,BTH,MIE | 6 |
| BTH,PTR,PTR,PTR,PTR,PTR,PTR,MCR,MIE | 6 |
The most common crop varieties cultivated on the same fields are shown in Table 7.
| u_rotation | Freq |
|---|---|
| BTH,MIE,MIS | 23 |
| BTH,MIS,ORH | 12 |
| BTH,MIE,PTR | 9 |
| BTH,MIS | 9 |
| BTH,CZH,MIE | 7 |
| BTH,CZH,MIS | 7 |
| BTH,LUZ,MIE | 7 |
| BTH,MCR,MIE,PTR | 7 |
| BTP,CZH,MCR,MLC,MLT,SGH | 7 |
| AVP,CPL,MPC,ORH,ORP,SRS,TRE,TTH | 6 |
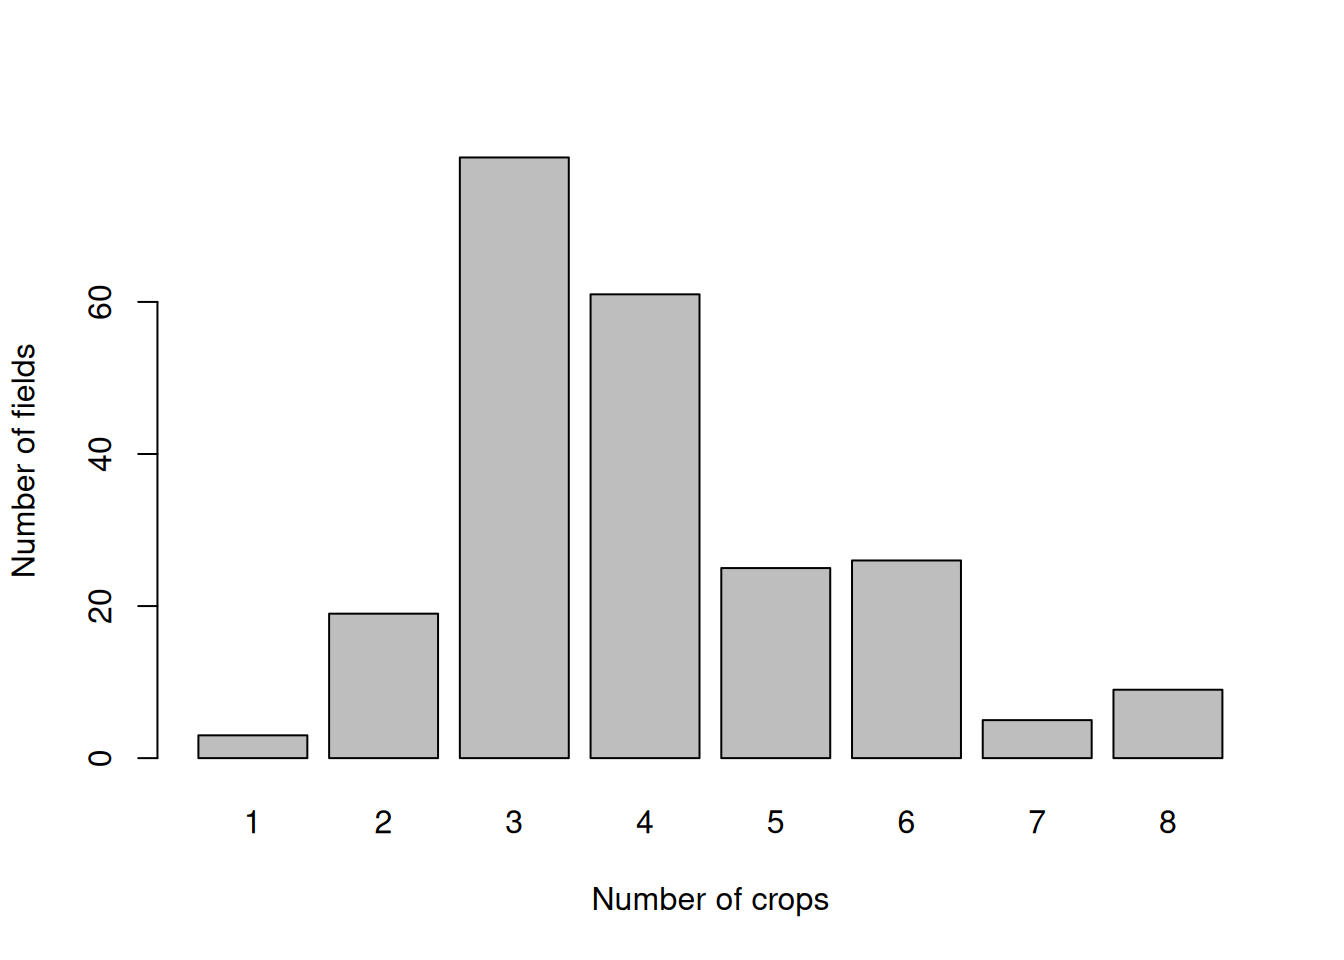
On most fields, there are between 3 and 4 different crops cultivated within the 2015-2023 period.
TO BE DISCUSSED:
- decide whether we simplify the crop types (e.g. merging MIE and MIS)
- is the order of the successive crops important? (e.g. CZH,BTH,MIE different from BTH,CZH,MIE ?)
TO BE IMPROVED:
- subset the crop sequence for each field between N-5 and N.
Field size
Perimeter
This is a tricky operation, because sub-fields do not overlap properly (different edges), and sometimes they have complex geometry. So far, the best solution that I found is to:
- aggregate (or dissolve) with
aggregate()
- merge non touching polygons by calculating convex hull
hull(type = "concave_length")
- and simplify the geometry to remove some unecessary complicated geometries with
simplifyGeom()
The perimeter is highly sensible to all theses steps (the area much less).
Number of sites with fields found in RPG sequence de culture
FALSE TRUE
4 223 Summary of the area of fields (in \(ha\))
Min. 1st Qu. Median Mean 3rd Qu. Max.
0.4956 2.3365 3.7666 4.6456 5.2915 29.0215 Summary of the perimeter of fields (in \(m\))
Min. 1st Qu. Median Mean 3rd Qu. Max.
307.4 641.1 849.3 916.3 1067.6 2566.4 TO BE DISCUSSED:
- are the areas and perimeters within expected range? what about the shape of the fields?
- how do we deal with issues identified visually, e.g. BIOHME_43_2020 (multiple fields + road)?
BD Haie and buffer
Let’s explore the dataset from BD Haie v2 mars 2024 from https://geoservices.ign.fr/bdhaie (1.5Gb compressed, 6.8Gb). BD Haie v2 is derived from images of the period 2020-2022 which is a better fit to our dataset than v1 based on images from 2011-2024.
Visualization
Let’s zoom in an area around Pleine-Fougères to visualize the hedges in BD HAIE (Figure 7).